What Metrics Are Used to Assess Assay Quality?
Author: Jason Duty
Learning Objectives
- Describe the important characteristics to measure when determining assay quality
- Summarize the popular metrics that have been used to assess assay quality
- Define the formulas to calculate the metrics for assay quality
- Evaluate and compare the advantages and disadvantages of the various metrics
Graphical Abstract

Legend. Images that describe the process of assessing and creating high quality assays. Assays are modified into a format for high-throughput screening and robotic devices conduct the experiment using positive and negative controls. The well plates are all stored and data is measured. Calculations are done using various metrics to determine if the assay used will be robust enough to use for the experiment. Image created with Canva Pro.
Why is it important to assess assay quality in HTS?
Experiments that utilize High-Throughput Screening (HTS) normally involve enormous amounts of compounds and data, making it important to identify the quality of the assay before being utilized. This is especially important as assays often need to be modified for use in HTS due to changes in protocol because of changed volume size, screening duration, instrument usage, and other factors. For example, an assay that was designed for a small number of large volumes might be modified to a much smaller volume conducted in wells in increments of 96 with a different screen duration performed at a screening center (1).
What is important to assess in Assay quality?
A good assay requires a methodology that results in a clear difference in the positive and negative controls while minimizing the variability (2). There are a few methods that measure these differences in these controls such as signal-to-background ratio and signal-to-noise ratio. These methods do not take into account the variability of both controls. Other methods such as Z-factor, assay variability ratio, and strictly standardized mean difference (SSMD) do account for data variability (2). However, maximization of these differences is not the only factor that must be considered. The expected intensity of the hits should also be taken into account (3).
Signal-based Metrics
The signal-to-background ratio (S/B) shows a simple comparison of the mean signal to the mean background. It does not contain any information about variability of the data. The signal-to-noise ratio (S/N) gives a measure of the degree of confidence that a difference in signal noise and background is real. It is compared to the variability of the negative control but does not account for any variability in the positive control (4). Both of the equations and others discussed are shown in Table 1. It is possible to have assays that show similar and significant S/B and S/N ratios, indicating differences in positive and negative controls, but that differ wildly in the overall quality of the assay (2). Without the full analysis of variability, these two methods are only useful as first steps of assessment or as supplementation to other metrics.
Metrics Analyzing Variability
Some of the metrics that take into account variability are signal window, assay variability ratio, Z-factor, and SSMD. HTS assays typically use very large libraries of compounds where most do not have any biological activity in the experiment and a measure of the activity will roughly follow a normal distribution. The threshold for a hit or potential success is usually set with a 99.7% confidence limit. Because of this, most of the metrics utilize the addition of three times the standard deviations of the positive and negative controls (4).
The signal window does take into account the variability of both positive and negative controls. Three times the standard deviations of these controls are subtracted from the absolute difference in their means. This is compared to the standard deviation of the negative control. While this does factor in both measures of variability, it can lead to false conclusions in assay quality due to the overlap in the distribution between the positive and negative controls (2).
The assay variability ratio is simply the Z-factor plus one. Both of these metrics compare the variability to the difference in means and take into account both variabilities. The format of the Z factor leads to a dimensionless parameter. The quality of the assay is judged between a
value of -1 to 1 where values closest to 1 are the highest quality. This provides a very simple and easy to understand method that accounts for both while accurately assessing situations that may cause issues for the assay variability ratio due to one control being significantly more
variable than the other. The difference between Z-factor and Z’-factor is that the former can analyze any HTS assay while the Z’ version is used only for control values (4).
The Z-factor has become one of the most widely used due to its advantages in simplicity, variability, and ease of use. If a HTS assay is utilizing a more complex assay, they can easily include a lower Z value. However, it does have some disadvantages. It does not scale with
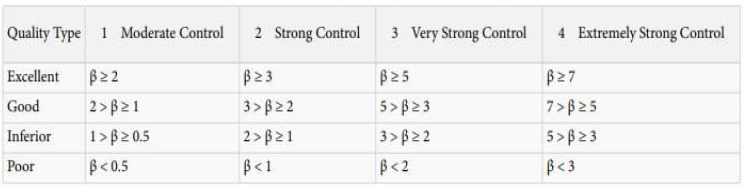
larger signal strength and assumes a normal distribution (3). Outliers or unusual cell types could give false values. The SSMD attempts to account for those by allowing higher thresholds for positive and negative controls. It is also more useful from a statistical standpoint as it is not as influenced by increasing sample size (2). The value given does account for the strength of the control and is seen in Table 2. It too has disadvantages as it is not as intuitive, widely accepted, and is not useful (like Z-factor) for identifying signal errors that are present on specific regions of a plate (5).
Table 1. Equations for the quality control metrics discussed for assessing assay quality. Image from Optimal high-throughput screening (2).
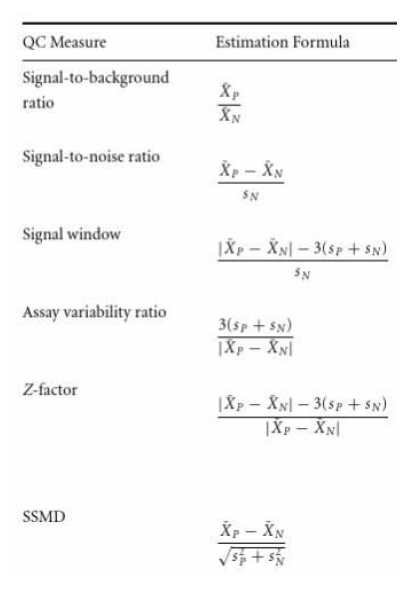
Table 2. Values of SSMD that correspond to various assay qualities. What the measurements mean differ depending on the strength of the control. Image from Advanced Assay Development Guidelines for Image-based High Content Screening and Analysis (3).
Resources
References
- Chai, S. C., Goktug, A. N. & Chen, T. Assay Validation in High Throughput Screening – from
Concept to Application. Drug Discovery and Development – From Molecules to Medicine
(2015). doi:10.5772/59765 - Zhang, X. D. Optimal high-throughput screening: practical experimental design and data
analysis for genome-scale RNAi research . (Cambridge University Press, 2011). - Bray, M.-A. & Carpenter, A. Advanced Assay Development Guidelines for Image-Based
High Content Screening and Analysis. Assay Guidance Manual [Internet]. (2017).
Available at: https://www.ncbi.nlm.nih.gov/books/NBK126174/. (Accessed: 30 April 2020) - Zhang, J.-H., Chung, T. D. Y. & Oldenburg, K. R. A Simple Statistical Parameter for Use in
Evaluation and Validation of High Throughput Screening Assays. Journal of
Biomolecular Screening 4, 67–73 (1999). - Chen, L. et al. mQC: A Heuristic Quality-Control Metric for High-Throughput Drug
Combination Screening. Scientific Reports 6, (2016).
Questions
- What must be considered when determining if an assay is appropriate to use? Two of the most important ones are to determine whether the difference between the positive and negative controls is large enough with variability minimized. More variability can cause more overlap in the positive and negative control values that you may not notice if just looking at the means. You also need to consider whether you are measuring the variability of both controls and account for other variables like strength of the control.
- Why do several of the formulas mentioned contain 3 times standard deviation? The threshold for a potential success or hit is often put at 99.7% confidence interval. This corresponds to three standard deviations so it is used in some of the metrics that add the standard deviations together.
- What is one way that the signal window metric could show an assay being better when it is not? Imagine a scenario where case C had a large variation in the positive control but very little variation in the negative control. Depending on the numbers, it is possible that case B appears to have a larger difference and be a superior assay. However, if it had large enough variation in both controls, the area of the distributions could overlap enough that case A was actually a better assay. This image from Optimal High-throughput Screening (2) shows the situation where D has a larger signal window but due to overlap C is actually the superior assay. This can be seen in the larger (less negative) Z-factor.
- Why has Z-factor become popular as a method? The Z-factor provides significant analysis of both the control difference and variability. It is also very intuitive to understand with values ranging from -1 to +1 which 1 being ideal. It works for many situations and is much simpler than other proposed methods such as SSMD.
- Should metrics like SSMD always be used over z-factor? There are situations where SSMD would be superior such as if you are using unusual cell types where you don’t know if there are unusual characteristics or non-normal distributions. Also if you are using controls with strengths that are outside of the thresholds as it doesn’t scale up as well. However, in other situations Z-factor likely would be used as it is very simple and adequate. It has also widespread acceptance so is used in many commercial and open-source software programs.