Z-factors
Author: Albert Shin
Introduction
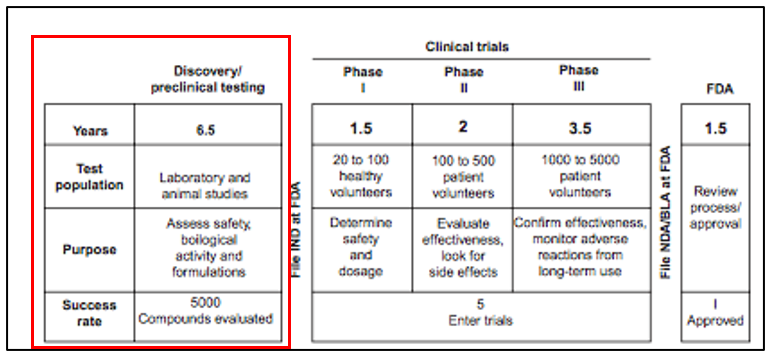
It was estimated that the biopharmaceutical companies in the U.S. expend $1 billion in average towards the R&D sector in order to bring new drug into the market []. In addition to this massive investment, the drug discovery process often takes 6.5 years until the company file the investigational New Drug (IND) application. Due to this massive investment, the biopharmaceutical companies seek to reduce the investments through a high-throughput screening method. The Z factor is a widely used method that determine whether the compounds or the value-added reagents are worth investigating forward during the initial screening process. This paper will address how Z-factor and Z’-factor are calculated, and the limitation of the Z- and Z’-factor.
Background
A Z-factor is a statistical formula used to validate the quality of high-throughput assay assuming a normal distribution of the response values. Z factor is calculated as the separation band divided by the dynamic range (i.e., the difference between the sample mean and the control mean), which is calculated as shown in Equation 1. The same equation can be expressed in Equation 2 when rearranged. Based on Z-factor value, the hits can be discerned. The Z-factor of 0 means no separation band and variation band of sample and of the control touches–and thus not worth investigating further. The Z-factor of 1 represents zero standard deviation and mean values (of sample and control) can be of any values; such value is an ideal hit. The Z-factor between 1 and 0.5 indicates separation band is large and worth investigating further. The Z-factor between 0.5 and 0 means separation band is small. The same interpretation of Z-factor can be applied to Z prime factor or Z’. The only difference is that Z’ instead compares between positive and negative control.
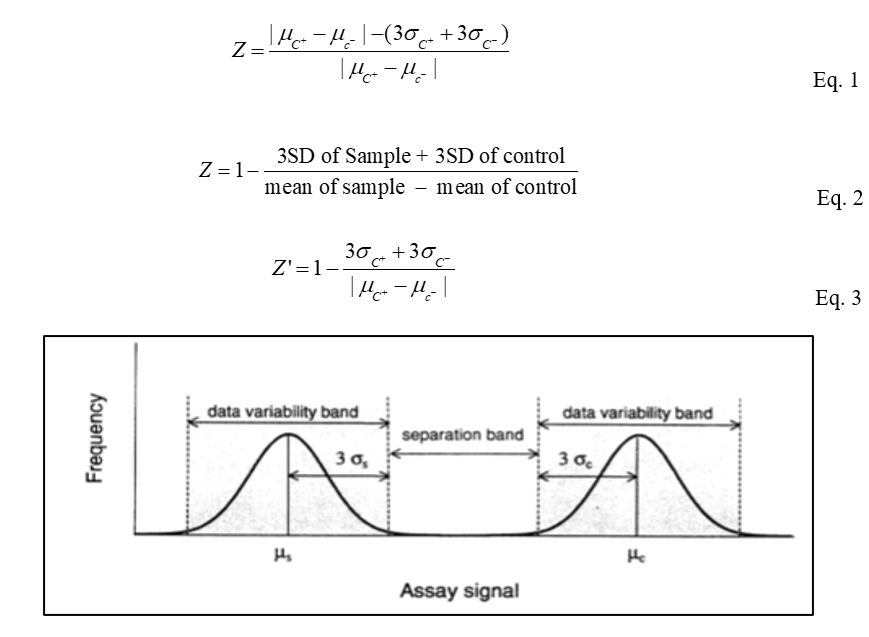
Figure 1. The distribution representation of the assay compared to the background or control. The separation band is the numerator of the Z-factor while the dynamic range is the distance between the mean of the sample and the mean of control.
Limitation
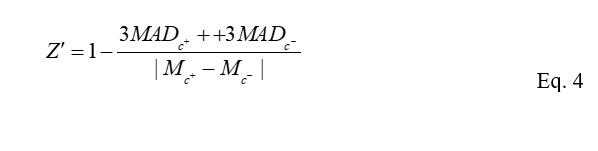
The standard Z’-factor is limited in that the model assumes the normal distribution of the response values. Although testing the library of the active compounds will highly likely result in the normal distribution when testing in a scale of millions, many other situations will result not in normal distribution. The study conducted by Atmaramani et al informed that Z’factor may be inadequate for testing the quality of the complex phenotypic screening. The study tested the assay quality of the dorsal root ganglion sensory neuron (DRG) and DRG excitability change which is typically seen in Nerve injury or inflammation. The study suggested a log transformation on the frequency count per well, rather than performing log transformation on the measured parameter, mean firing rate. The robust form of Z’ factor was performed which takes in median and median average deviation. The equation is written as follows:
Audio Recording
References
- Gilled, S., and Smith P C. “The Oxford Handbook of Health Economics” Sep 2012.
- Atmaramani, R, Pancrazio, J J, and Black B J. “Adaptation of robust Z’ factor for assay quality assessment in microelectrode array based screening using adult dorsal root ganglion neurons,” (339), June 2020.
- Zhang, J H, Chung T D, and Oldenburg, K. “A Simple Statistical Parameter for Use in Evaluation and Valdiation of High Throughput Screening Assays,” Journal of Biomlecular Screening, (4)
Questions
- What is this? The z’ factor was described in this short memorandum as a topic associated with high-throughput screening. The z’ factor statistics is a widely used method to identify the hit from the library of the compounds tested in the high-throughput screening process.
- Why is it important? The z’-factor is an important topic because this mathematical formula is used to winnow down the list of hits from the library of the compound tested. The impact of the high-throughput screening is also great in the drug discovery process which is regarded as time-consuming and demands large investments. The pharmaceutical companies spend in average 15-20% of the sales into the R&D department
- List the learning objectives. The learning objectives are: Learn how Z-factor and Z’-factor are calculated and fundamentally understand what it means; Learn the limitation of the Z-factor
- How does this approach, technology, or concept relate to social and environmental justice…? The high-throughput technology will innovate the drug discovery process that now seems a daunting and huge undertaking to bring a new drug into the market. This process will be eased and bring new drugs out for the patients in need.